Retinal inference: connecting gene expression to tissue damage
How I used regression, feature attribution, and pathway analysis to investigate retinal responses to spaceflight.
My NASA research included analyzing a regression ensemble for a study of retinal damage in spaceflown mice, published in *npj Microgravity*. My contribution involved cross-model feature comparisons, pathway-level interpretation, and comparative results and figures incorporated into the manuscript. The original analysis notebooks were developed by James Casaletto as part of the broader collaboration. Published study.
The problem connects two measurements of the same biological system: RNA sequencing describes gene expression, while tissue imaging measures injury. I was interested in the reasoning between them—how an expression pattern becomes a prediction, and how that prediction becomes a biological hypothesis.
What the analysis taught me
Preserve the phenotype's resolution
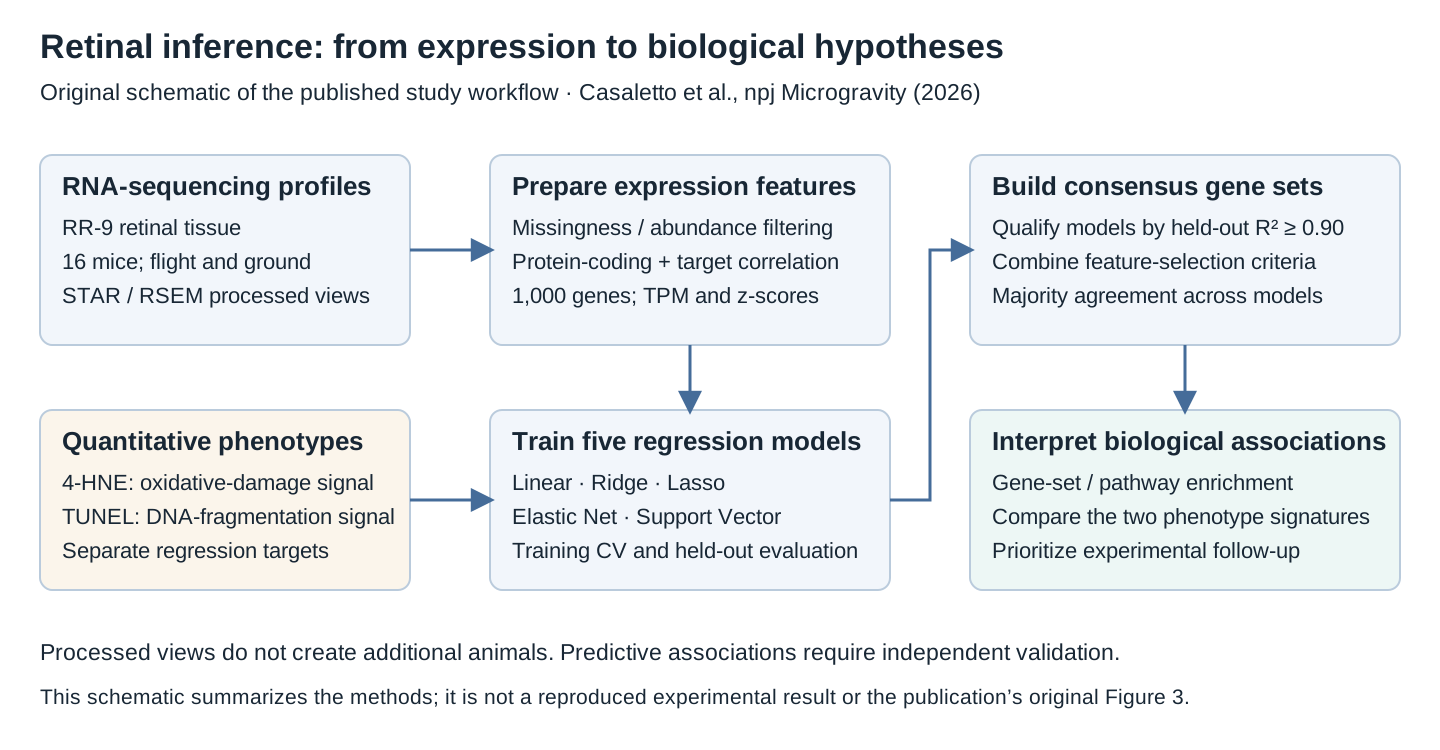
The pipeline uses retinal transcriptomics from Rodent Research-9 to predict two quantitative imaging phenotypes. 4-HNE measures a signal associated with oxidative lipid damage; TUNEL measures DNA fragmentation associated with apoptosis. Modeling them separately lets each endpoint have its own predictive signature.
Regression preserves differences that a high/low classification would discard. Two samples just above a classification threshold can have very different injury measurements. A continuous target retains that distance and makes prediction error biologically interpretable.
The preprocessing narrows the expression matrix to 1,000 target-correlated protein-coding genes after missingness and abundance filtering. TPM normalization accounts for sequencing depth and gene length; z-score scaling makes expression magnitudes more comparable. Those choices define the information the models can use, including which low-abundance signals they cannot recover.
Compare the assumptions behind a prediction
The ensemble contains ordinary linear regression, ridge, lasso, elastic net, and support vector regression. Ridge shrinks coefficients through an L2 penalty; lasso's L1 penalty can remove features; elastic net combines both. These differences matter when many genes carry overlapping information: similar predictions can emerge from different allocations of importance.
I compared what those models emphasized. Permutation feature importance measures the loss in predictive performance after disrupting one gene. Recursive feature elimination rebuilds models while removing weak features. Coefficient magnitude supplies another view, although its meaning depends on scaling and correlations between predictors.
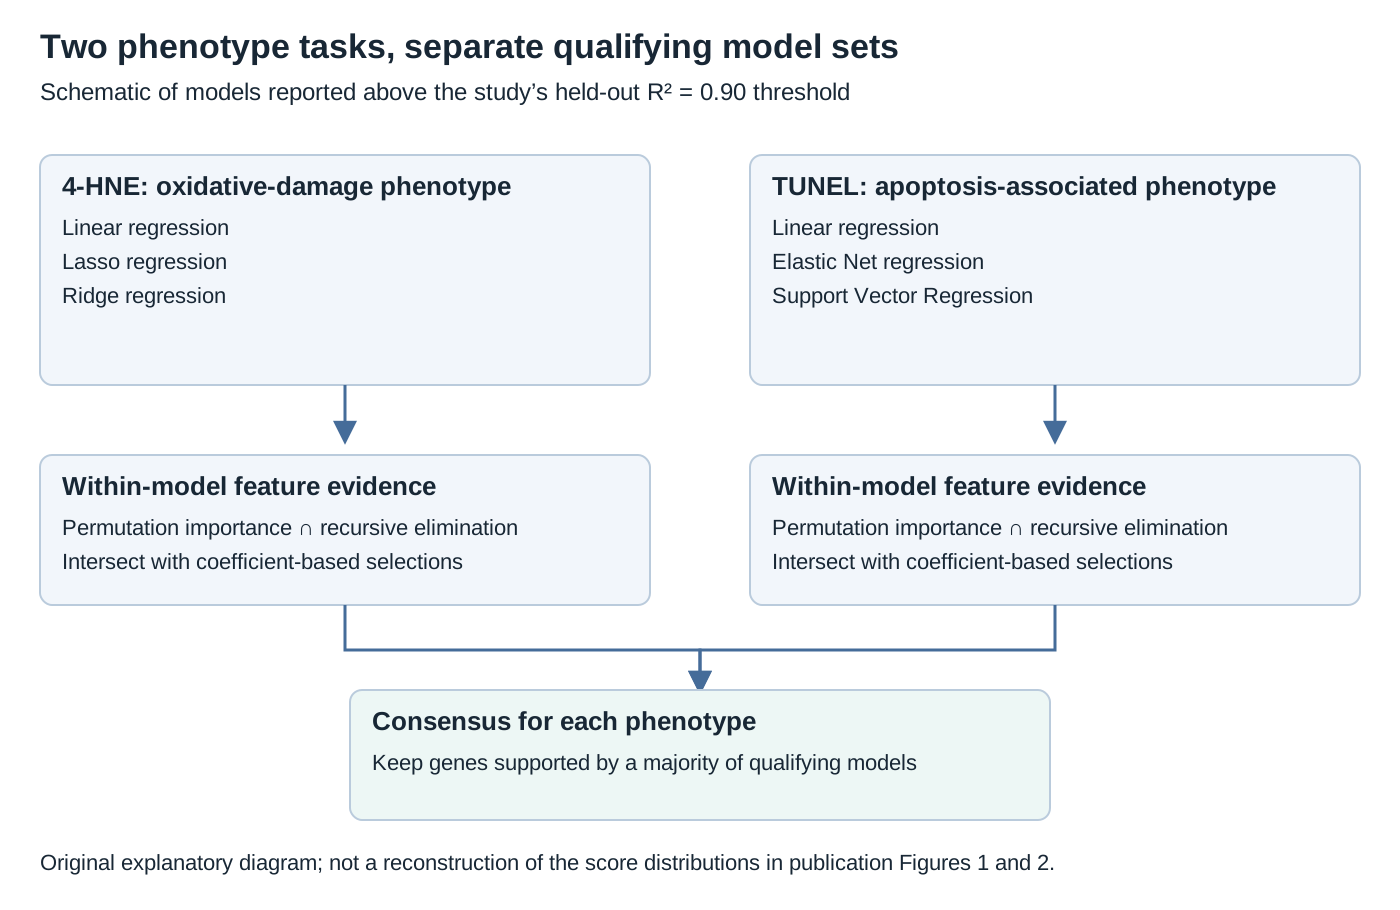
The pipeline intersects permutation and elimination selections with coefficient-based selections within each model, then takes a majority consensus across qualifying models. This makes the gene list an explicit evidence-aggregation procedure rather than the output of one preferred estimator.
Keep model fit separate from biological confidence
For each phenotype, three models exceeded the study's held-out R² threshold of 0.90. That is strong fit within the reported experiment, whose biological sample size was 16 mice. STAR and RSEM provide alternative processed views; they do not create additional independent animals.
The held-out data also participate in model qualification and feature attribution. Those results therefore support discovery within this study; an untouched external cohort would provide a stronger test of the selected signature's generalization.
Following the prediction into biology
Pathway enrichment asks whether the selected genes overlap curated biological functions more than expected by chance, with multiple-testing correction. It adds functional context to the ranking. The study connected the oxidative-damage signature with membrane and synaptic processes, while the apoptosis signature emphasized photoreceptor degeneration and cellular stress.
My main learning was to follow that entire chain: measurement, representation, model assumptions, feature evidence, and biological interpretation. A convincing analysis explains both why a gene was selected and what additional experiment could distinguish a predictive association from a mechanism.